Geological Map of the Argentine Puna and Geological Map of the Cuyo Region
Geological Map of the Argentine Puna (22º-28ºS) and Geological Map of the Cuyo Region (28º-33ºS)
Salfity Geological Consultant specializes in the preparation of digital geological maps (GIS) mainly at scales 1:100,000 and 1:250,000.
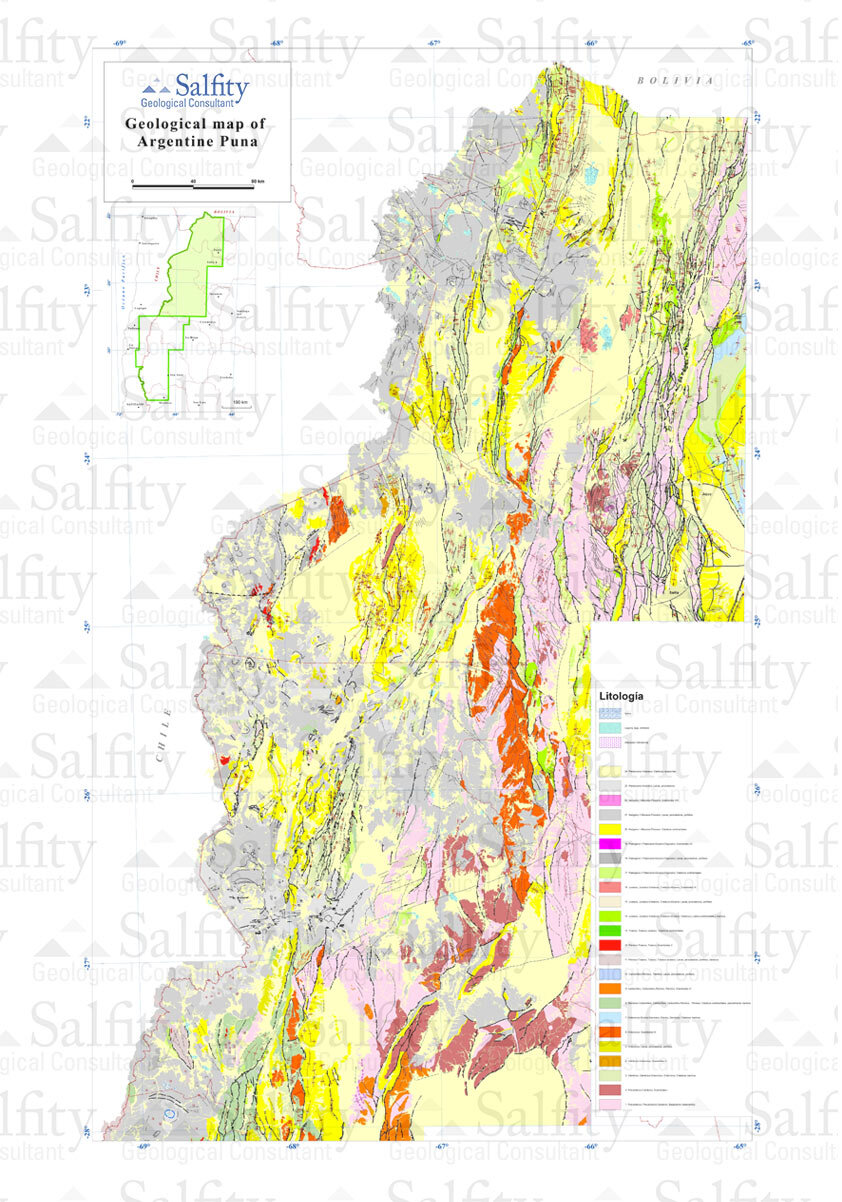
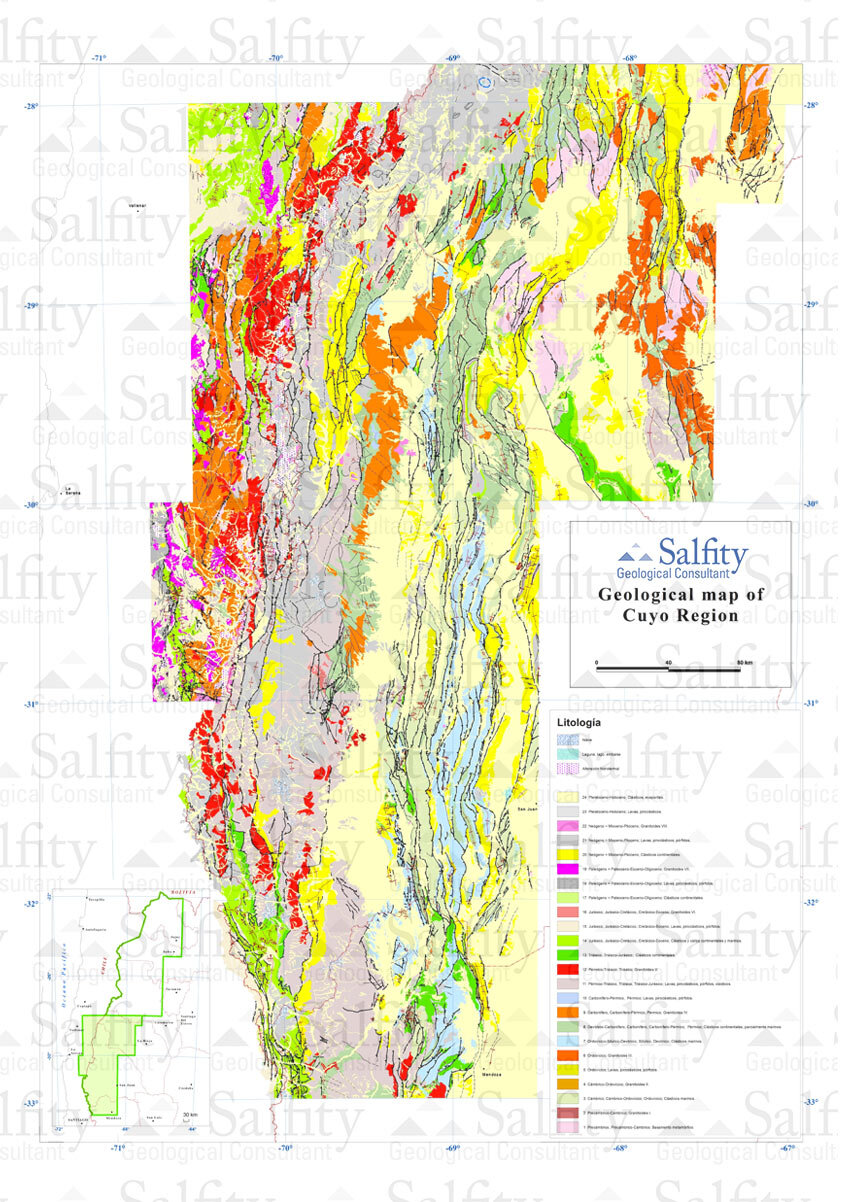
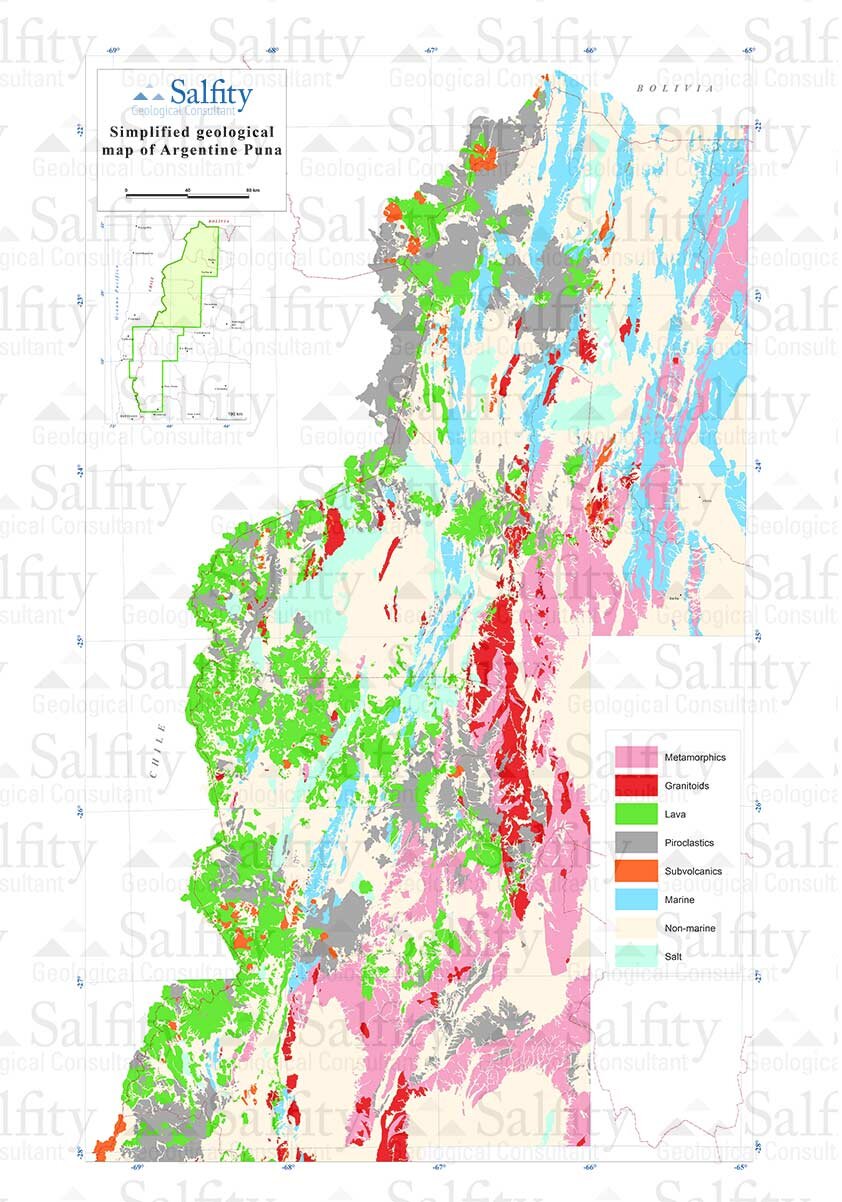
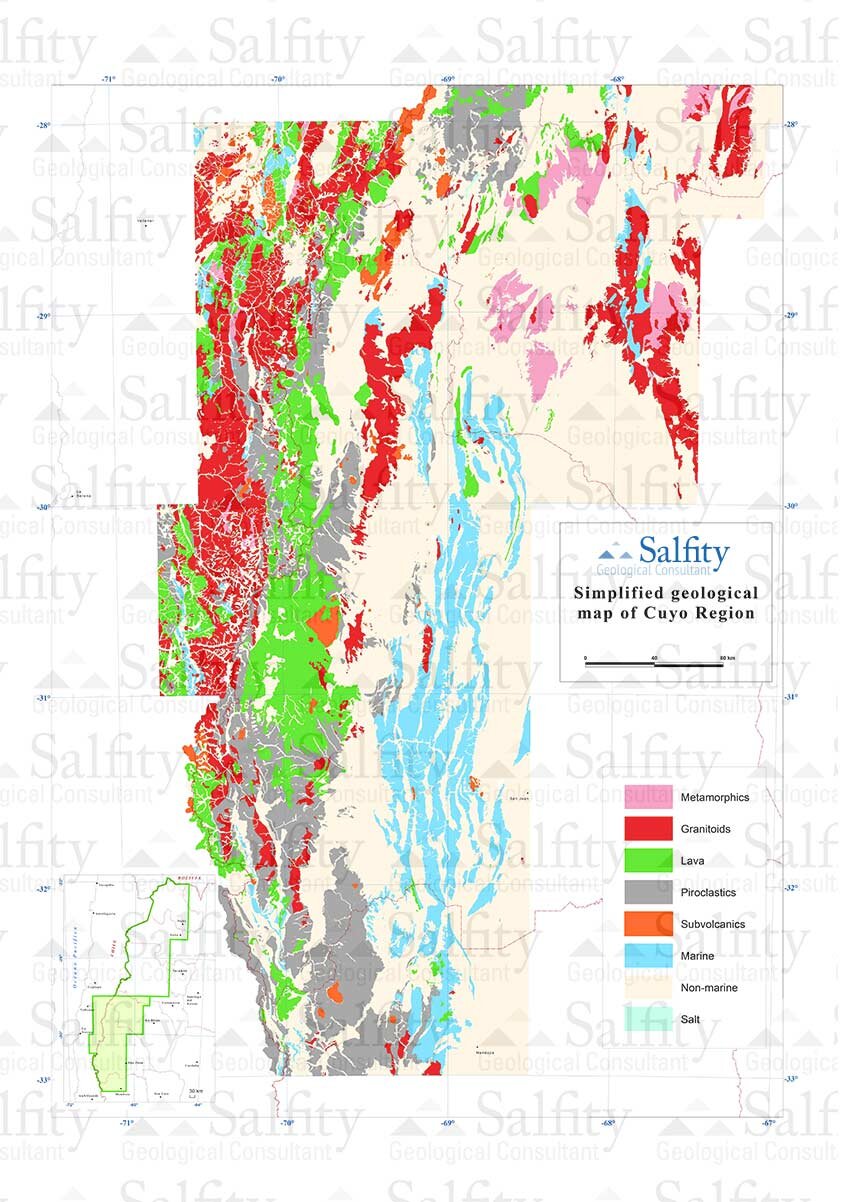
The geological maps presented here (Figures 1 and 2) are the result of processing the available stratigraphic and structural information of the Argentine Andes between the Argentina-Bolivia boundary (22ºS) and the latitude of the city of Mendoza (33ºS).
Both are perfectly compatible and it is possible to unify them in a single map. A joint print at a scale of 1:500,000 measures 2,50 m long.
To facilitate the reading of the 1:500,000 scale map, note that the references had to be simplified to 24 stratigraphic units (Figures 1 and 2). The more detailed the scale, the greater the number of stratigraphic units represented.
Geological Map of the Argentine Puna
Figure 1 – Geological map of the Argentine Puna (22º-28º S)
Geological Map of the Cuyo Region
Figure 2- Geological map of the Cuyo Region (28º-33º S)
Optimization of the mapping required prior correlation of all stratigraphic units. This required the preparation of correlation tables of the 1091 stratigraphic units represented in both maps.
On the basis of the available geological cartography, all geological contacts have been redrawn and/or modified by cross-checking with satellite images.
The stratigraphic and structural information provided here represents an excellent geological platform both for regional work (scales 1:500,000 and 1:250,000) and for the preparation and creation of maps with a higher level of detail (1:100,000 and, in some parts, 1:50,000). See an example at 1:100,000 scale (Figure 3).
Both tables are fundamental for the optimal management of the geological map.
Stratigraphic Table
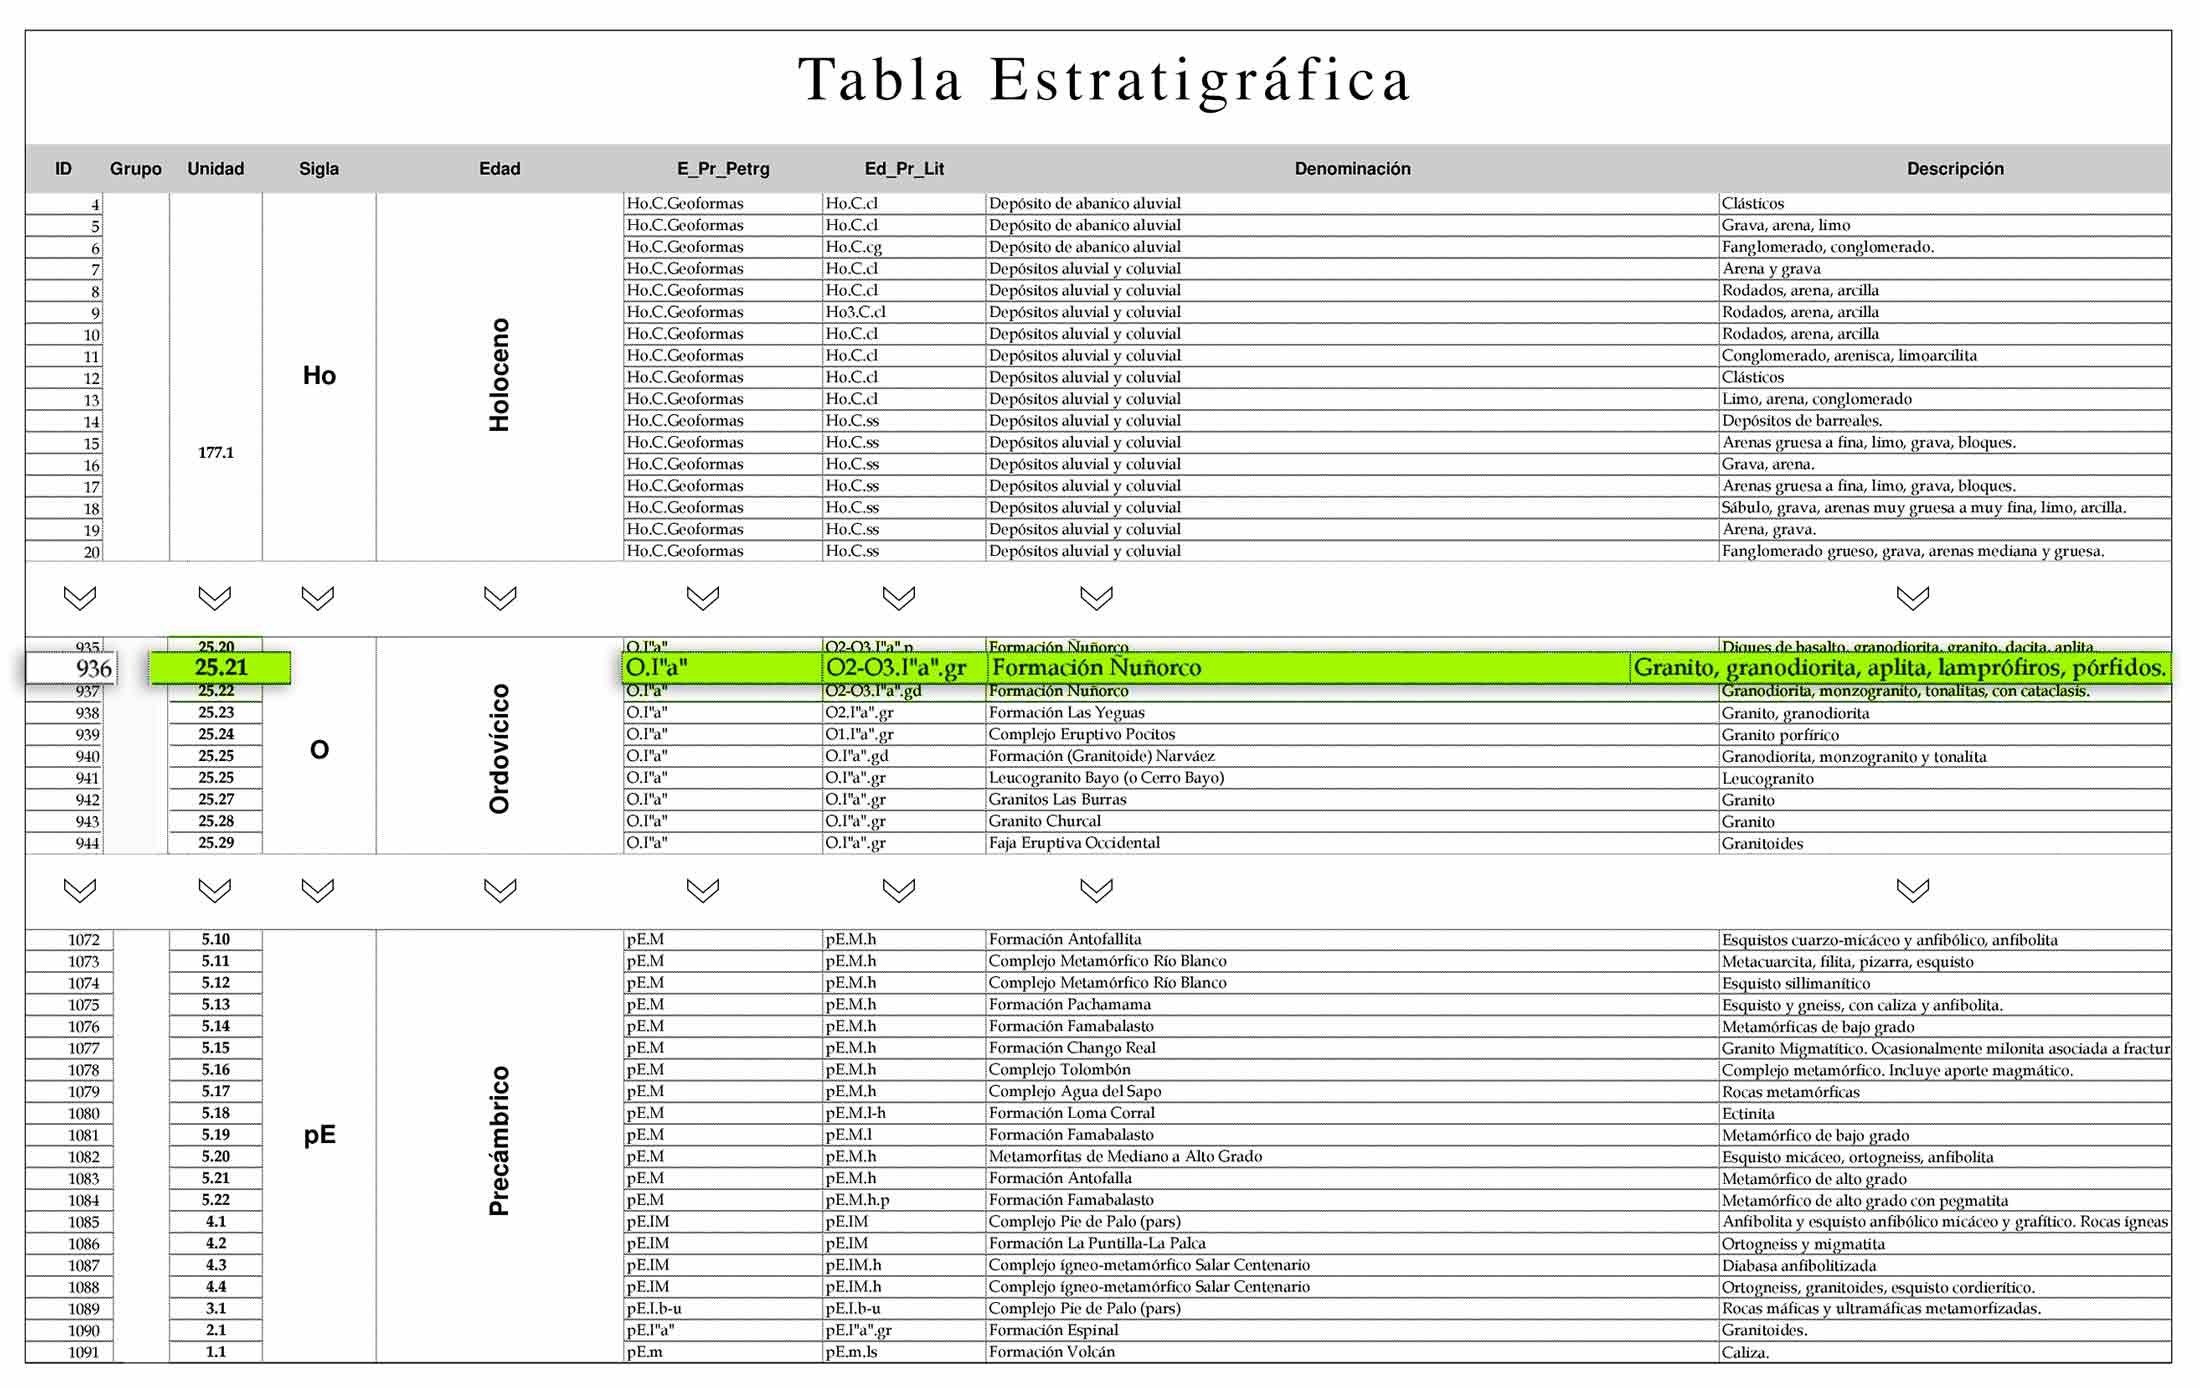
It contains 1091 stratigraphic units identified from the Precambrian to the Quaternary, where the acronym, age, name and lithology of each unit are indicated.
Stratigraphic Table (Figure 4)
Chronostratigraphic table
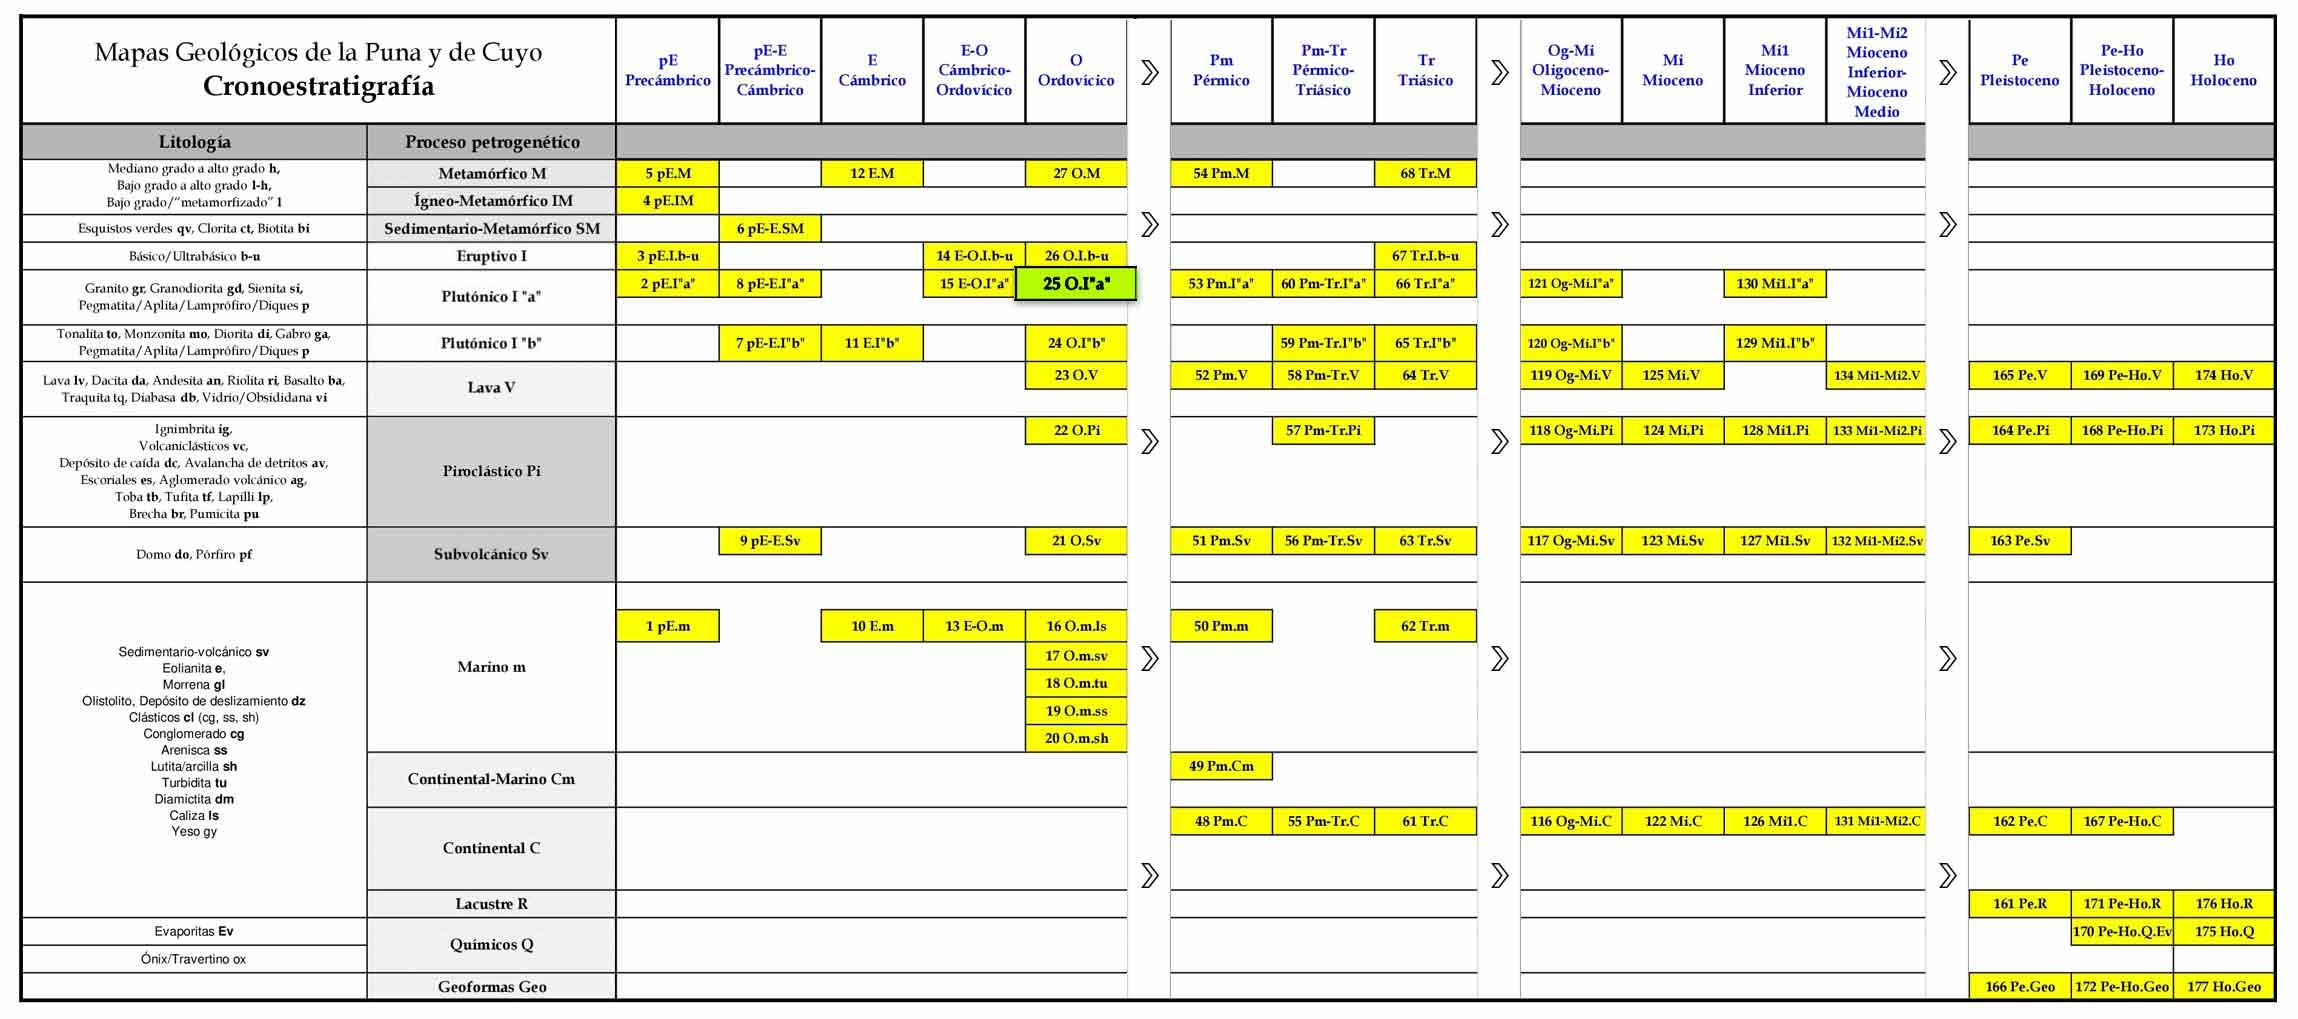
The lithologies are classified according to 15 petrogenetic processes represented in the ordinates of the table and, in the abscissae, the 41 lapses distributed between the Precambrian and the Holocene.
Within the Table 177 Groups are distinguished, which are the result of the classification of the 1092 units of the Chronological Table according to the origin of lithology and age. The number of stratigraphic units that compose each Group is indicated in the Stratigraphic Table.
Chronostratigraphic table (Figure 5)
Identification on the map
Each of the 1091 lithological units is identified by two numbers separated by a dot. Example: 25.21 (Figure 4).
The number 25 identifies one of the 177 groups of the Chronostratigraphic Table and represents Group 25 O.I “a” Acid Granitoid of the Ordovician (Figure 5).
Number 21 comes from the Stratigraphic Table and represents the Lithological Unit Ñuñorco Formation in facies of Granite, granodiorite, aplite, lamprophyre, porphyry.
It should be noted that Group 25 O.I “a” is composed of 29 Ordovician acidic plutonic formations
Example of map editing
The Chronostratigraphic Table facilitates the choice and organization of the references to be included in the map to be prepared.
Example: It is possible to prepare a Magmatic Map as a mining prospecting objective (in this case lithological, not chronological) that compares the distribution of magmatism with respect to the metamorphic basement and Phanerozoic sedimentary facies (Figures 6 and 7).
This map would include only seven major units (it is possible to add all structures):